User Group Statistics
User Group Statistics gives you a bird’s-eye view of a user group’s workload.
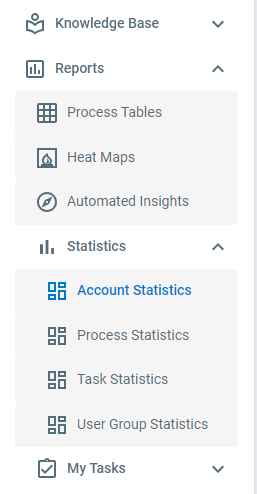
To access User Group Statistics, do the following:
-
Log in to your account
-
Click Reports > Dashboards > User Group Dashboard
-
Select a User Group
The User Group Statistics page shows:
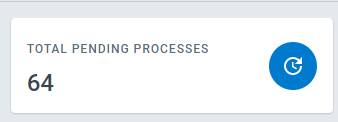
- Total Pending Processes - The number of processes with tasks currently waiting on members of the user group
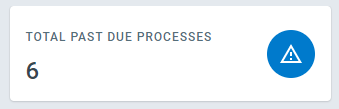
- Total Past Due Processes - The number of processes with past due tasks currently waiting on members of the user group
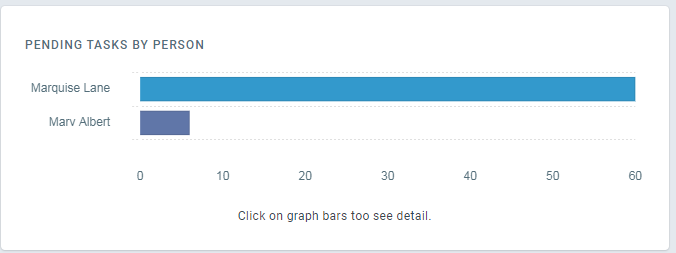
- Pending Tasks by Person - This graph shows the number of pending tasks assigned to each person in the user group. Clicking the graph bars will show more details.
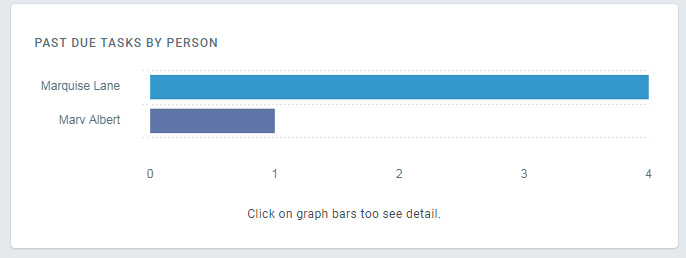
- Past Due Tasks by Person - This graph shows the number of past due tasks assigned to each person in the user group. Clicking the graph bars will show more details.
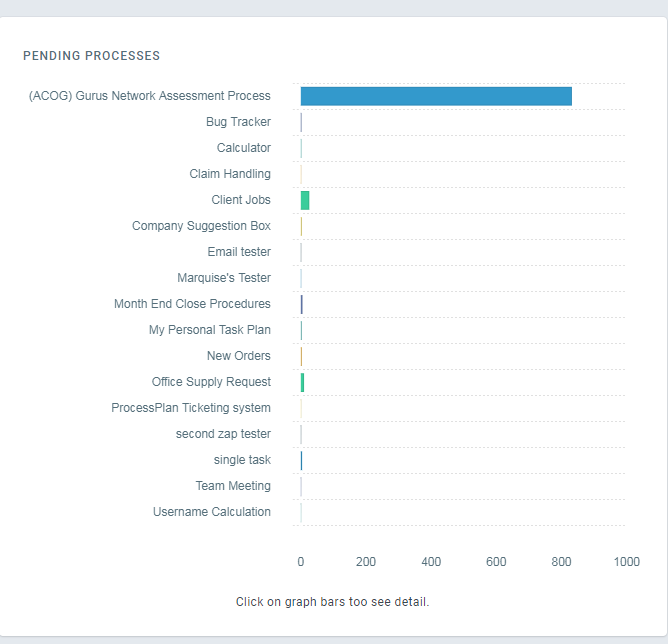
- Pending Processes - A breakdown of the processes and tasks currently waiting on members of the user group. Clicking graph bars will provide more detail.
-
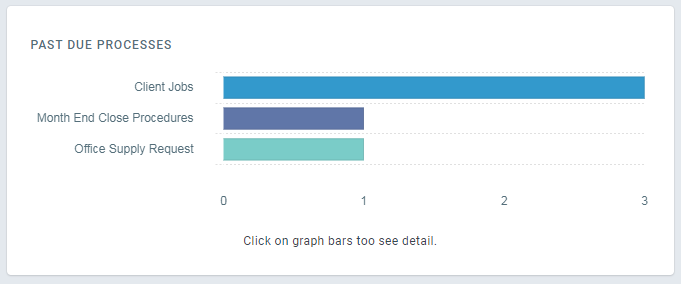
Past Due Processes - A breakdown of the processes and tasks with Past Due tasks waiting on members of the user group. Clicking graph bars will provide more detail.
-
Average Task Completion Time By Person (Days) - How long each member of the group takes on average to complete a task.
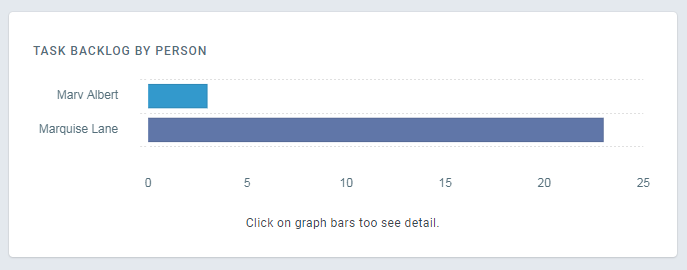
- Task Backlog by Person - A breakdown of the number of tasks assigned to each user group member.