
Process Statistics
Process Statistics allow you to take an in-depth look at a process. These insights can help improve and/or maintain process efficiency.
To access the Process Dashboard, do the following:
-
Log in to your account
-
Click Reports > Dashboards > Process Dashboard
-
Select a Process
The Process Statistics page shows:
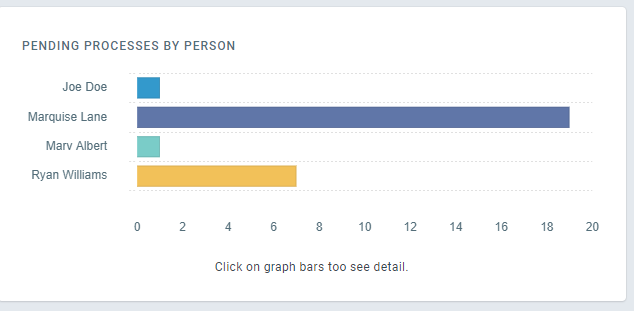
- Pending Processes - The number of instances currently running in the account
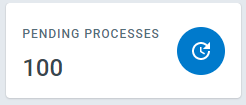
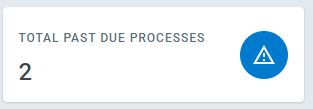
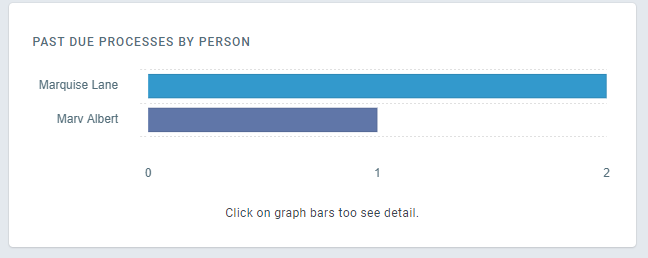
- Past Due Processes - The number of instances with a past due task
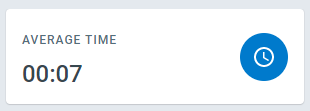
- Average Time - The average time it takes to complete a task in this process (in minutes)
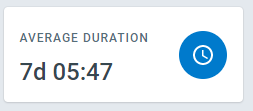
- Average Duration - The average time it takes to complete the entire process (in hours)
- Pending Tasks by Person - This graph gives a count of the pending tasks in the selected process, broken down by assigned user.
- Past Due Tasks by Person - This graph gives a count of the past due tasks in the selected process, broken down by assigned user.
-
Pending Tasks (Count) - Pending task counts broken down by task
-
Past Due Tasks (Count) - Past due task counts broken down by task
-
Pending Tasks Max Age (Days) - The oldest pending task’s age, by task
-
Completed Tasks Average Duration (Days) - How long each task takes on average
-
Processes Started - How many instances of this process were started over time