
The Diagram Editor
The diagram editor is where you build a process visually: add steps, connect them, and arrange the layout so the flow is easy to read. This page is a tour of everything you can do on the canvas.
The shapes on the canvas
Section titled “The shapes on the canvas”Each shape on the diagram means something specific:
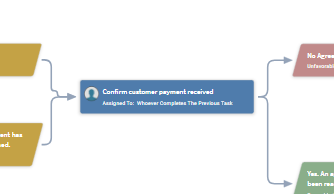
- Task - a step someone (or something) does. Blue and full-width. A task always leads into a response.
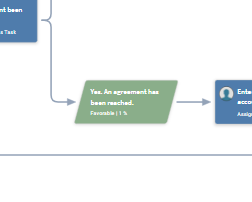
- Response - the outcome of a task, drawn as a slanted parallelogram so it reads differently from a task at a glance. A task can have multiple responses (Yes / No, Approved / Rejected, and so on), and each one becomes a branch in the flow.
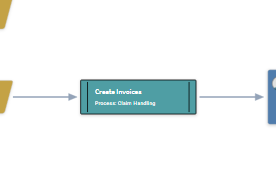
- Subprocess - a link to another process template. Teal, with a black outline and the standard flowchart double-bar markers. Double-click a subprocess to open the linked process.
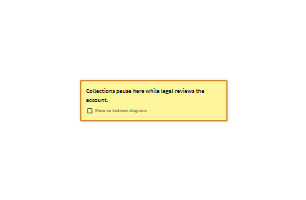
- Sticky note - a free-floating annotation. Notes don’t affect the process flow; they just document what’s happening on the canvas.
Every diagram also starts with a Start node, which marks the entry point of the process and can’t be deleted.
Add a step
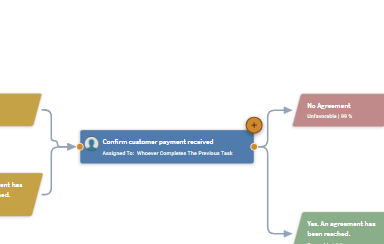
Section titled “Add a step”Hover over (or click) any node and an amber + button appears at its top-right corner. Click it to add the next node in the flow: a task gets a response, a response gets a task. The new node lines up automatically.
Draw a connection between steps
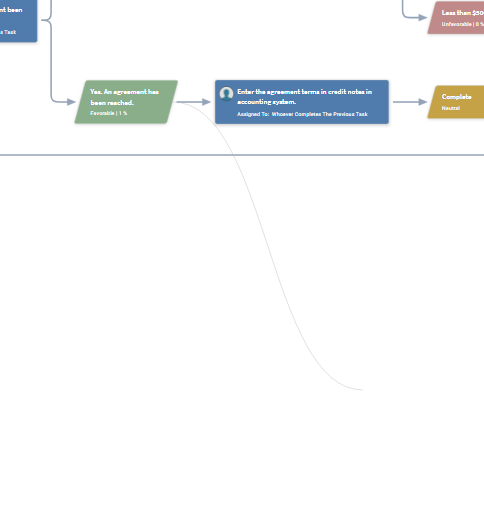
Section titled “Draw a connection between steps”Hover over a node to reveal its connection points: small amber dots on its left and right sides. The left dot is for incoming connections, the right dot for outgoing. Click and drag from a connection point to another node to create a link.
Connections that don’t make sense in a process (task to task, response to response, and so on) are rejected with a message explaining why.
Reroute a connector
Section titled “Reroute a connector”Connector lines route at right angles automatically, and they keep out of each other’s way: where two lines would otherwise run along the same path, one of them shifts across so both stay visible. Lines still cross each other where the flow calls for it. Where several connectors leave the same step, they fan out into their own lanes instead of stacking up as one thick line. Connectors arriving at the same step do the opposite: they merge onto one shared line into that step, so a merge point in the process reads as a single path in rather than a bundle of lines wandering apart and then rejoining at the arrowhead.
When a connector loops back to an earlier step, it always travels back underneath the steps it passes: down out of the step it leaves, back below everything between it and its target, then up into that target. It clears only the part of the diagram it actually crosses, so a short return between two neighbouring steps stays close to them instead of diving under the whole process. A return path is never routed through the steps it passes, so it can’t be mistaken for part of the forward flow. Where several loop-backs cover the same stretch of the diagram, they stack into their own rows, with the shorter returns nearest the steps.
Each loop-back also gets an amber handle in the middle of its horizontal segment. Hover over or select the connector to reveal the handle, then drag it down to give that line more clearance below the steps it passes. It won’t move up into the steps, and it won’t wander far below them either: drag it either way past the limit and it settles back in with the other return lines. If you drop it right on top of another connector, it moves clear of that line instead of vanishing behind it.
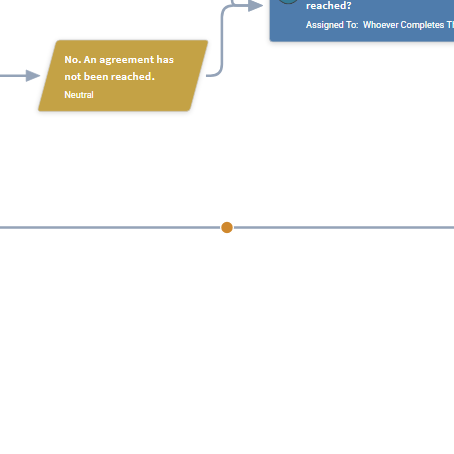
Moving a step resets the routing on every connector attached to it, incoming and outgoing, so lines stay tidy as the layout changes.
In a very tightly packed diagram there may not be room to separate every line completely. Dragging the steps a little further apart gives the connectors the space they need.
Move around the canvas
Section titled “Move around the canvas”- Zoom with the mouse wheel (or pinch on a trackpad).
- Pan by clicking and dragging any empty area of the canvas.
- The diagram automatically fits to your screen the first time it loads.
- The overview map in the bottom-right corner shows the whole diagram in miniature, with a frame marking the part you’re currently looking at. Drag inside the map to move to another part of the process, or scroll on it to zoom. On a wide process this is the fastest way to get your bearings. The map appears only while part of the diagram is off screen: zoom out far enough to see the whole process and it gets out of the way on its own. It also stays hidden on phone-sized screens, where pinch and drag do the job.
Find a step
Section titled “Find a step”Type in the search box in the toolbar to find a step by its wording. Every step that matches gets a red outline, and the diagram travels to the first match, zooming in far enough to read it if you were zoomed out.
A counter appears in the top-left corner of the canvas showing which match you are on, such as 2 / 7. The ‹ and › buttons beside it step through the rest, in the order the matches appear along the flow from left to right. When nothing matches, the counter says No matches.
Search looks at both lines of a step: its main text and the smaller line of detail underneath.
Add a sticky note
Section titled “Add a sticky note”Right-click an empty area of the canvas and choose Add Sticky Note. Double-click a note to edit its text.
Notes added on a template stay on the template, and notes added on a running process stay on that process. On a template, right-click a note to choose whether it also appears on the diagrams of running processes (Show on Instance Diagrams).
Tidy up automatically
Section titled “Tidy up automatically”Right-click empty canvas and choose Auto Format Diagram to recompute the whole layout. Only the process flow is rearranged; sticky notes keep their hand-placed positions.
Auto-format only ever runs when you ask for it. The editor never rearranges your diagram on its own; see Your Diagram Keeps Its Shape.
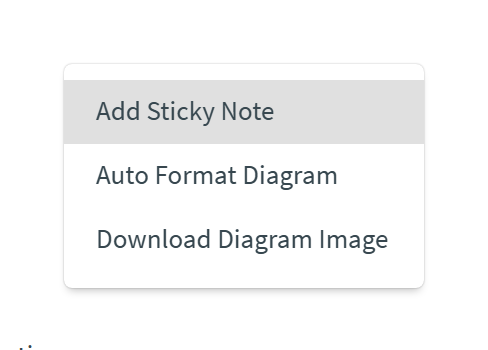
The same menu is where you can download an image of your diagram.
Select, copy, and delete
Section titled “Select, copy, and delete”- Click a node or connector to select it.
- Shift+click (or Ctrl+click) to add more items to the selection.
- Hold Shift and drag across empty canvas to select everything in an area.
- Ctrl/⌘+C copies the selection and Ctrl/⌘+V pastes it (pasting also works into a different template’s diagram). Automated actions on a pasted task or response are copied with it, and an action that runs after another pasted action follows the pasted copy.
- Delete or Backspace removes the selection. The Start node can’t be deleted.
Undo and redo
Section titled “Undo and redo”Ctrl/⌘+Z undoes the last change. Ctrl/⌘+Y (or Ctrl/⌘+Shift+Z) redoes it.
Edit text inside a node
Section titled “Edit text inside a node”Double-click anywhere on a task, a response or a sticky note to edit its text in place. You do not have to click the words themselves, anywhere on the node works. Enter commits the change, Shift+Enter adds a line break, and Esc cancels. Subprocess steps are the exception: double-clicking one opens the linked process instead.
Save your work
Section titled “Save your work”Changes stay on your screen until you click Save in the toolbar. Nothing is saved automatically, so you can experiment freely and leave without keeping a change. When you do save, the diagram is stored exactly as you arranged it, and every running process shows that same layout. See Your Diagram Keeps Its Shape.