Table Summary Reports
Table Summary Reports are a quick and easy way to create reports for instances in a specific process.
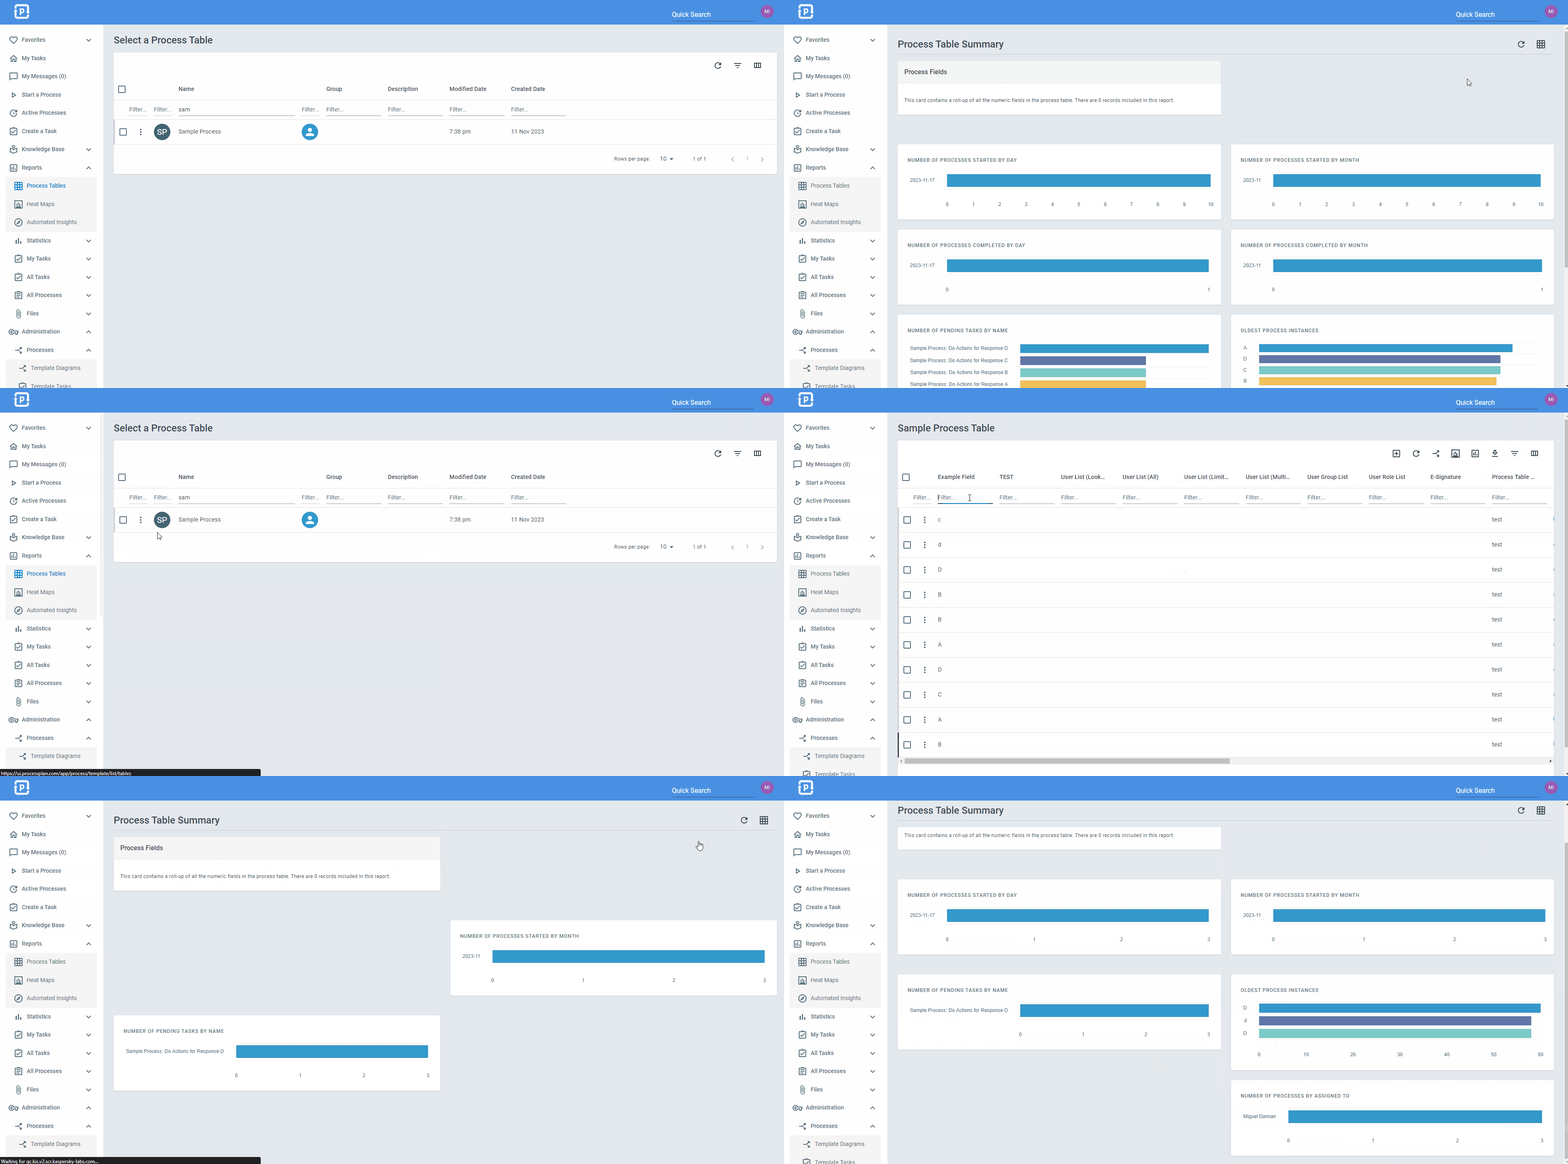
To access a table summary report:
-
Log in to your account
-
Click on Reports > Process Tables > Then select the process table of your choice
Once you have your process table pulled up, you can press the Summary Report icon on the top right to create the report for that process.
In the report you can find:
-
Number of processes started by day/month: Total number of instances that have been started in that process
-
Number of processes completed by day/month: Total number of instances that have reached 100% completion
-
Number of pending tasks by name: Number and name of tasks that have yet to be completed in that process
-
Oldest process instances: List of active instances in the process categorized by how long they have been pending
-
Average process completion time: Average time that it takes for an instance to reach 100% completion
-
Number of processes by assigned to: Number of active processes categorized by who they are assigned to
-
Optional: If you have any numerical only fields in your process, ProcessPlan can also calculate reports such as sum total, average, largest value, smallest value, etc.
Filtering Process Table Reports
Section titled “Filtering Process Table Reports”You can also filter the process table prior to creating the report to produce a different report with the added filters. See the example below.