
Heat Maps
The Heat Map allows you to see how many pending tasks there are at each stage in your Process.
To view the Heat Map for a process, do the following:
- Click Reports > Heat Maps > Click the card of the Process you want to see the heat map for
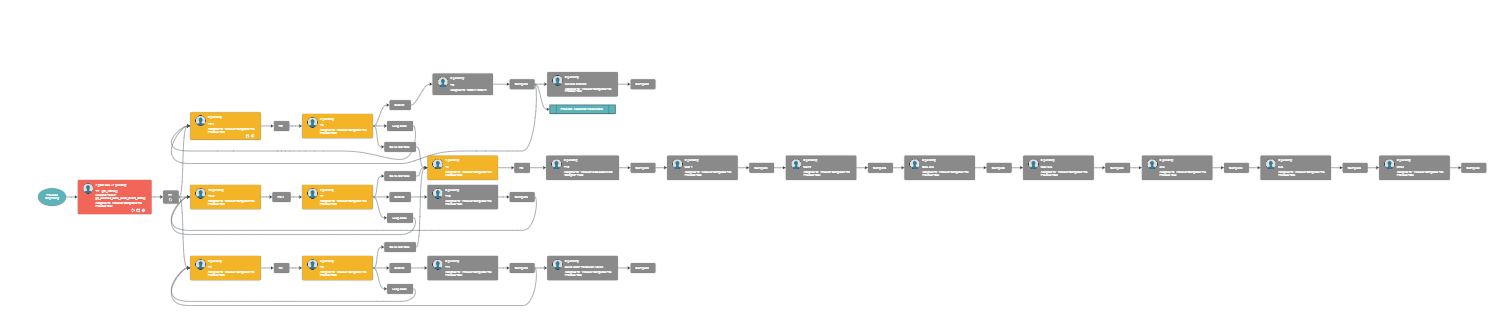
On the Heat Map, the color of each task will give you more information about the status of each task.
-
Red Task - There is a past due instance of this task pending
-
Yellow Task - There is an instance of this task pending
-
Gray Task - There are no pending instances of this task
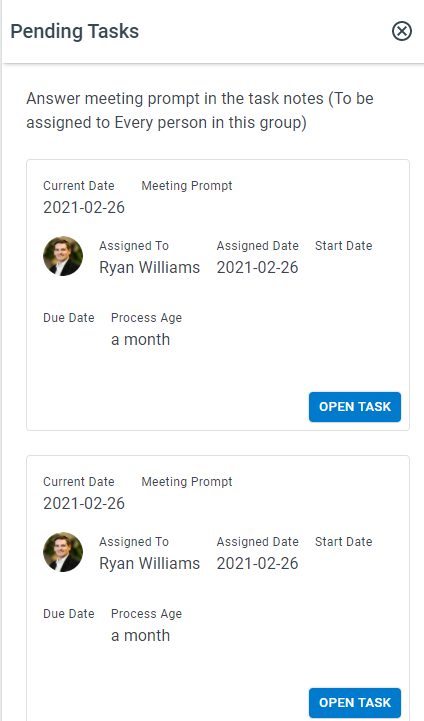
You can click any task in the heat map to open and complete a pending task. Clicking a task brings up the following:
-
Assigned to - The user this task is assigned to
-
Assigned Date - The date the task was assigned
-
Start Date - The day this task started. Start dates are primarily set on the process template
-
Due Date - The day the task is due
-
Process Age - The length of time the process has been running
Clicking Open Task opens the Task Panel for the task.