
Process Diagrams
Every process template, and every running process, can be viewed as an interactive flow diagram. Diagrams make structure obvious at a glance: what happens first, what branches, and where work converges.
Viewing a diagram
Section titled “Viewing a diagram”Open a template or a running process and switch to its diagram view. The diagram shows each step as a node, with connectors indicating the order of flow.
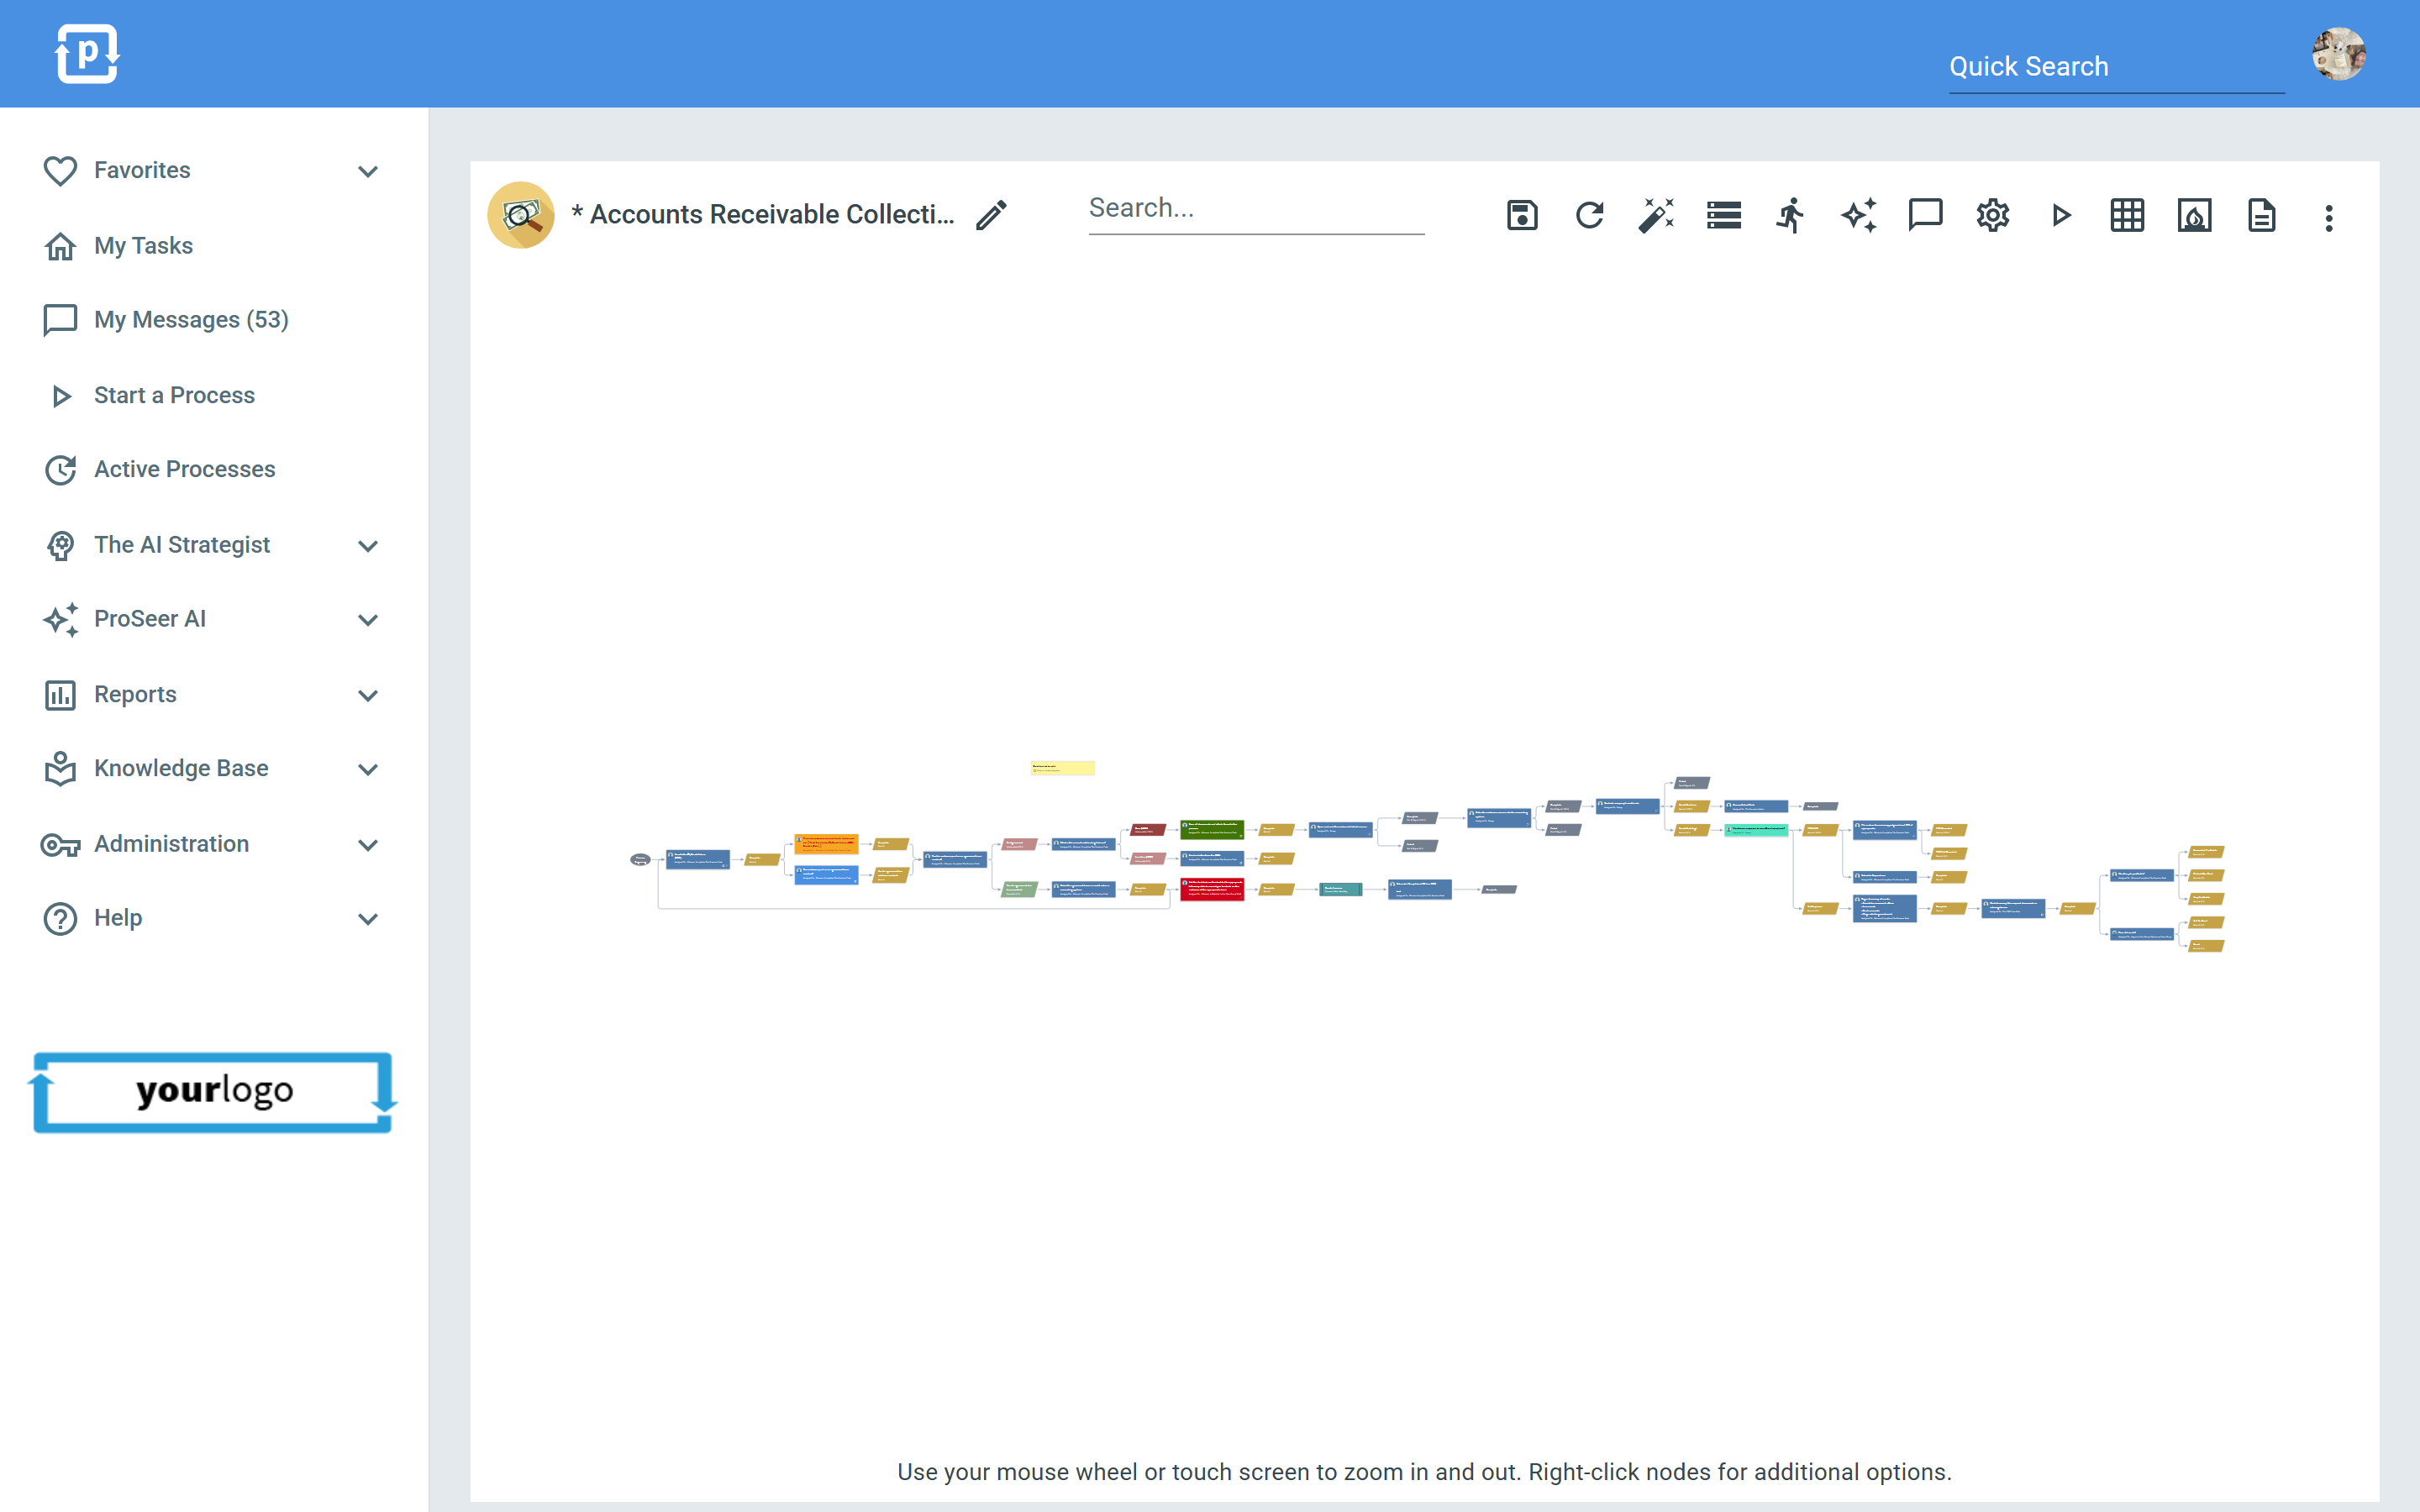
For running processes, the diagram doubles as a live status board: a heat map highlights completed steps and the process’s current position, so you can see progress and bottlenecks without reading through task lists.
Editing a template diagram
Section titled “Editing a template diagram”Template diagrams are editable:
- Add and connect steps - drag nodes into place and draw connectors between them.
- Rename a step - double-click anywhere on a task, a response or a sticky note to edit its text in place.
- Move things around - connector lines route at right angles, and you can drag a connector’s handles to route it around other steps for a clean layout.
- Copy and paste - duplicate steps within a diagram using standard keyboard shortcuts.
- Auto-format - right-click empty canvas and choose Auto Format Diagram for an automatic tidy-up, whenever you want one.
Changes are saved back to the template, so the next launch follows the updated flow. The layout is saved too, exactly as you arranged it, on the template and on every running process. See The Diagram Editor for the full editing tour, and Your Diagram Keeps Its Shape for how layouts are preserved.
Drilling into subprocesses
Section titled “Drilling into subprocesses”If a step links to another template as a subprocess, double-click it to drill into the linked diagram. This works in both template and instance views, letting you navigate a large operation level by level.
Sharing
Section titled “Sharing”Diagrams can be shared in a read-only public view, useful for showing a process to someone outside your ProcessPlan account.